
Retail Sales Week: How Smart Money Trades USD
Key Takeaway: While retail traders fixate on NFP and CPI, institutional desks actively position around US Retail Sales data — making it one of the most exploitable inefficiencies on the economic calendar for traders who know how to read smart money behavior around the release.
Smart Money Concepts and the Retail Sales Release Most Traders Ignore
Every trader on the planet circles Non-Farm Payrolls and CPI on their economic calendar like it's Christmas morning. And fair enough — those events move markets. But there's a mid-tier release that institutional desks genuinely care about, one that the retail crowd consistently dismisses as background noise: US Retail Sales.
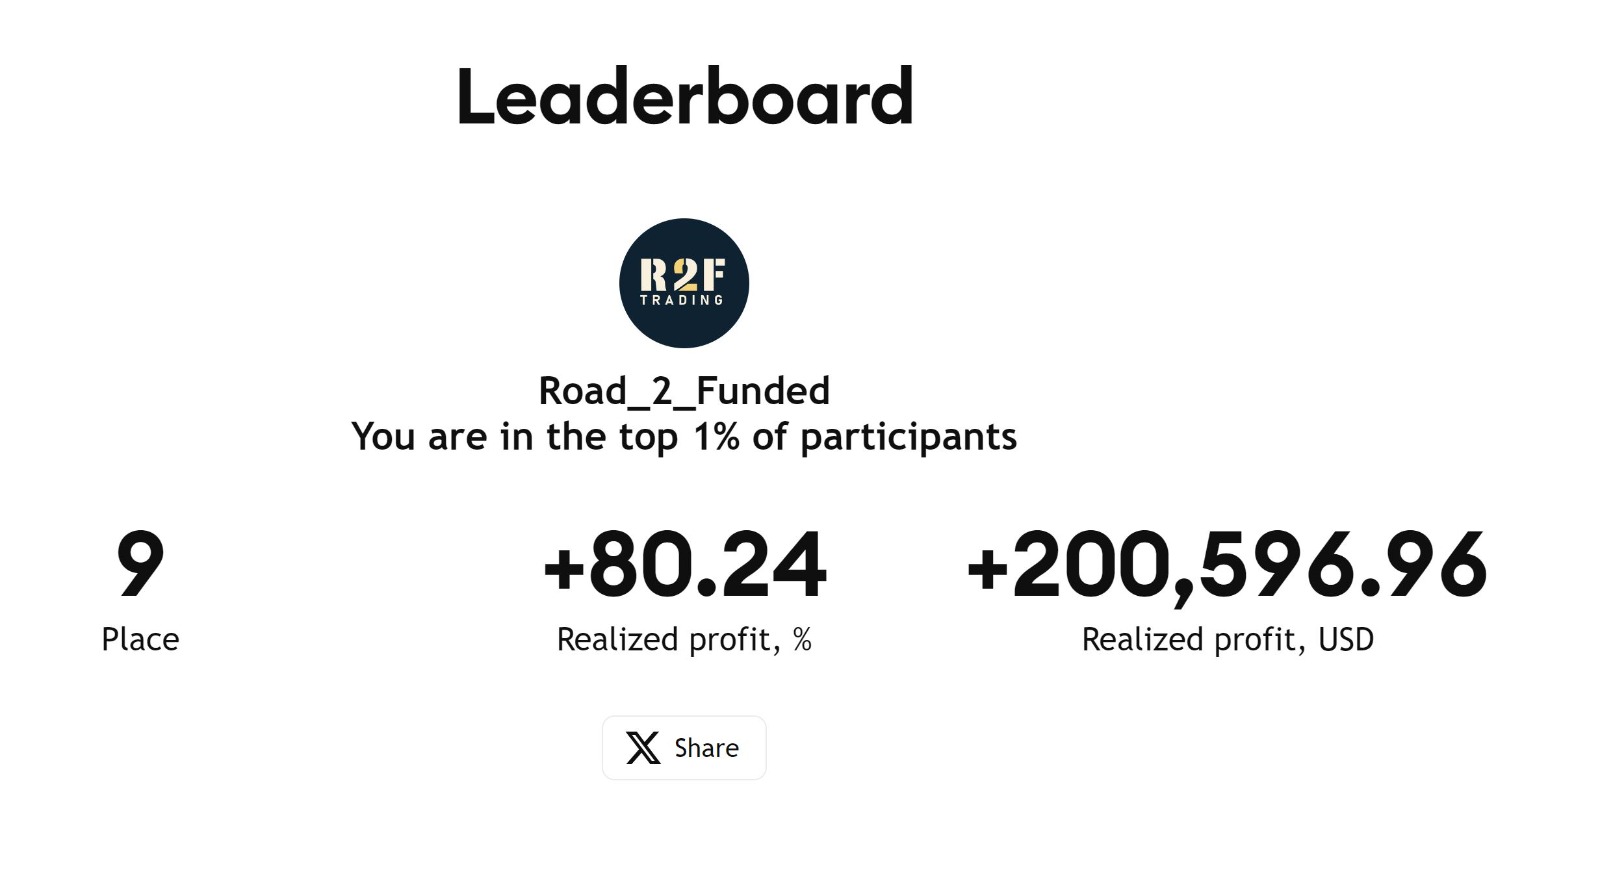
I've been doing this for over ten years. I've passed FTMO Challenges, landed TradingView Editors' Picks, and finished in the top 1% of trading competitions. I've also sat with my charts in the quiet hours before more Retail Sales releases than I can count — and I'll tell you straight: smart money concepts apply here just as surgically as they do around any tier-one event. The difference is most ICT traders never bother to look.
This article is going to change that. I'm going to walk you through exactly how institutional players position on USD pairs in the 24–48 hours surrounding a Retail Sales release, using order blocks and liquidity sweeps to frame entries before the number ever hits the screen.
Why Retail Sales Actually Matters to Institutional Players
Retail Sales measures consumer spending across US goods-selling businesses. It's published monthly by the US Census Bureau and is one of the Federal Reserve's primary gauges of consumer health — which directly influences rate expectations, which directly moves the dollar.
When the number beats expectations significantly, it signals a stronger consumer, which typically supports a hawkish Fed stance, which strengthens USD. Miss badly, and you get the reverse. Simple enough on paper.
Here's what most retail traders miss: the positioning doesn't begin when the number drops. It begins 24 to 48 hours before.
Institutional desks can't dump hundreds of millions of notional into the market in one click without moving price against themselves. They build positions gradually, using liquidity in the market to absorb their orders. That process — the accumulation phase — is exactly what smart money concepts teach us to read.
The 48-Hour Institutional Playbook: What I Watch Before the Release
Step 1: Mark Your Weekly Highs, Lows, and Previous Day Structure (48 Hours Out)
Starting two days before Retail Sales drops, I zoom out to the daily and 4-hour chart on the primary USD pair I'm watching — usually EUR/USD, GBP/USD, or DXY as context.
I'm looking for:
- Previous week's high and low — these are liquidity pools. Old highs are resting buy-stops. Old lows are resting sell-stops.
- The current week's developing high or low — which side is price gravitating toward?
- Any unfilled Fair Value Gaps from the prior 3–5 sessions — these act as magnets for price in the accumulation phase.
The goal here isn't to predict direction. It's to map the battlefield before anyone fires a shot.
If you want a deeper framework on reading these pre-news structures, I covered the full 48-hour liquidity playbook in my breakdown of how to trade NFP Friday with ICT smart money concepts — the principles translate almost identically to Retail Sales week.
Step 2: Identify the Pre-News Liquidity Sweep (24 Hours Out)
This is the most important phase, and the one where smart money concepts do the heaviest lifting.
In the 24 hours before Retail Sales, I almost always see one of two things:
Scenario A: A sweep of the prior day's high or low before a reversal Price aggressively takes out sell-stops below a recognizable swing low, then reverses and closes back inside the range. This tells me smart money just got filled on longs using the liquidity from retail traders who were stopped out. I'm now looking for a mitigation entry on a lower-timeframe order block.
Scenario B: A slow, grinding accumulation in a tight range that engineers no liquidity sweep at all This is actually more dangerous for retail traders, because price will often punch violently through both sides of the range the moment the data hits — taking out stops on both sides before committing to direction.
Knowing which scenario is unfolding changes everything about how I size and where I place my stop.
Step 3: Build Your Order Block Thesis on the 1H–15M Chart
Once I've identified the liquidity sweep, I drop down to the 1-hour chart to find the last up-candle before a bearish institutional move (bearish order block) or the last down-candle before a bullish institutional move (bullish order block).
Here's my exact criteria before I even consider an entry:
- The order block must be formed after a liquidity sweep — not randomly placed in the middle of a range.
- Price must have left the zone with displacement — a strong, impulsive candle that creates a visible Fair Value Gap.
- The zone must align with a premium or discount array — I'm only buying order blocks in discount (below equilibrium of the range) and selling them in premium (above equilibrium).
- Killzone timing must be respected — London open (2–5 AM EST) or New York open (7–10 AM EST). Outside of these windows, I don't enter. Period.
For a more granular checklist on validating FVG entries specifically, I'd point you to the ICT Fair Value Gap trading checklist I put together — nine confirmations I run through before every single entry.
Step 4: Set Your Entry Window — And Know When to Step Aside
One of the biggest mistakes traders make around news events isn't entering at the wrong level. It's refusing to step aside when the setup isn't clean.
For Retail Sales specifically, I use this decision framework:
- If I have a clean order block with displacement + liquidity sweep alignment + killzone timing: I'll enter before the release with a defined stop below the order block.
- If the setup is ambiguous or price is mid-range: I wait for the spike post-release, let price sweep a level and return, then look for entry on the re-test.
- If price has already run significantly in one direction in the 3 hours before the release: I don't chase. The move is likely already done for smart money — they don't need a second bite.
The discipline to walk away from ambiguous setups is what separates traders who pass funded account challenges from those who blow up trying to trade every event. I wrote about this in detail in 7 fatal mistakes that kill your funded account challenge success — mistake number three is almost always over-trading economic events.
Reading the Reaction: What the Post-Release Price Action Tells You
Even when I'm already in a trade, I watch the post-release price action as confirmation — not as a reason to panic.
Here's what I'm looking for in the first 5–15 minutes after Retail Sales drops:
- Initial spike vs. continuation: A clean, directional spike that doesn't retrace more than 38.2% of its range in the first 5 minutes is typically real institutional follow-through. A spike that immediately retraces more than 50% is a manipulation — smart money used the news to fill orders against the initial retail reaction.
- Volume expansion on LTF: On a 5-minute chart, I want to see widening spread and volume expansion on the follow-through candles, not on the initial spike candle.
- FVG creation post-news: If the move leaves a clean Fair Value Gap on the 15-minute chart in the direction I'm already positioned, I'll often add to the position on the first return to that gap — provided it happens within the same session.
For a broader look at how these concepts apply to the current macro environment, why Q2 2026 market structure shifts are breaking traditional ICT setups covers some important context around how liquidity patterns have evolved this year.
The Pairs I Focus On for Retail Sales Week
Not every USD pair reacts equally to Retail Sales. My priority order:
- EUR/USD — deepest liquidity, cleanest institutional footprints, most reliable order block reactions.
- GBP/USD — slightly more volatile, but excellent for post-release re-tests if you miss the pre-release entry.
- USD/JPY — I treat this one differently because JPY carries its own macro narrative. I only trade it on Retail Sales week if the JPY side is quiet.
- DXY (as context, not a tradeable instrument for most) — always running as a reference chart to confirm or invalidate setups on the pairs above.
You can read more about ICT-based approaches to news trading and much more across the trading insights section of the site — there's a deep library there if you want to go further.
What My Students Do Differently on News Weeks
The traders I work with who've gone on to pass funded challenges and build consistent records don't treat Retail Sales like a coin flip. They treat it like a structured opportunity with defined parameters.
They map liquidity 48 hours out. They identify the pre-news sweep. They build an order block thesis on the 1H with killzone timing requirements. And they have a written rule — not a feeling, a rule — for when to step aside.
You can see the kind of progress that structured approach produces on our student results page.
How to Build This Into Your Process
Here's your step-by-step summary:
- 48 hours out: Mark weekly and prior-day highs/lows. Identify unfilled FVGs. Note premium/discount levels.
- 24 hours out: Watch for a liquidity sweep of a recognizable swing point. This is your signal that accumulation is in play.
- Entry session: Drop to 1H–15M. Identify the order block formed after the sweep. Confirm displacement, FVG, and killzone timing.
- Post-release: Monitor initial spike vs. retrace ratio. Look for FVG creation on follow-through for potential add.
- Non-setup days: Walk away. Protecting capital on low-conviction days is a skill, not a weakness.
If you want to go deeper on any of this — or have me personally review how you're approaching news weeks — our coaching plans start at $150/week for Lite, $200/week for Pro, or $1,000 for four months of Full Mentorship. Every level includes direct access to me and real-time trade review.
Or if you're not sure which plan fits where you're at right now, book a free discovery call and we'll figure it out together. No pitch, no pressure — just an honest conversation about what you need to get to the next level.
Retail Sales week isn't a throwaway event. It's a window into how smart money moves. Start treating it that way.
Harvest Wright
ICT Trading Coach · 10+ Years Experience
Harvest specializes in ICT methodology and has helped traders pass prop firm challenges, develop consistent strategies, and build the psychology needed for long-term profitability.
Book a Free Discovery Call →Take Your Trading to the Next Level
Get personalized 1-on-1 ICT coaching with Harvest Wright. Free discovery call, no commitment.
Book a Free Discovery CallFree ICT Trading Checklist
The exact checklist I use before every trade. Get it free.